OWOW's clients had no central place to track their project's progress, budget, or key contacts. This led to a lot of unnecessary back-and-forth communication that put strain on both the clients and the OWOW team.
A dual-sided client portal built in Next.js with a Supabase backend. Clients get a live view of their project status, budget, team contacts, documents, and latest activity all in one place, without having to ask anyone for updates.
Before touching Figma or writing any code, I did a competitor analysis on Basecamp and Toggl Track to understand what works well in client-facing dashboards.
I started by making an initial dashboard mockup in Figma following OWOW's visual identity. My group ended up going with a teammate's design as the base, so I focused my design work on the budget page and a few overview cards for the dashboard.
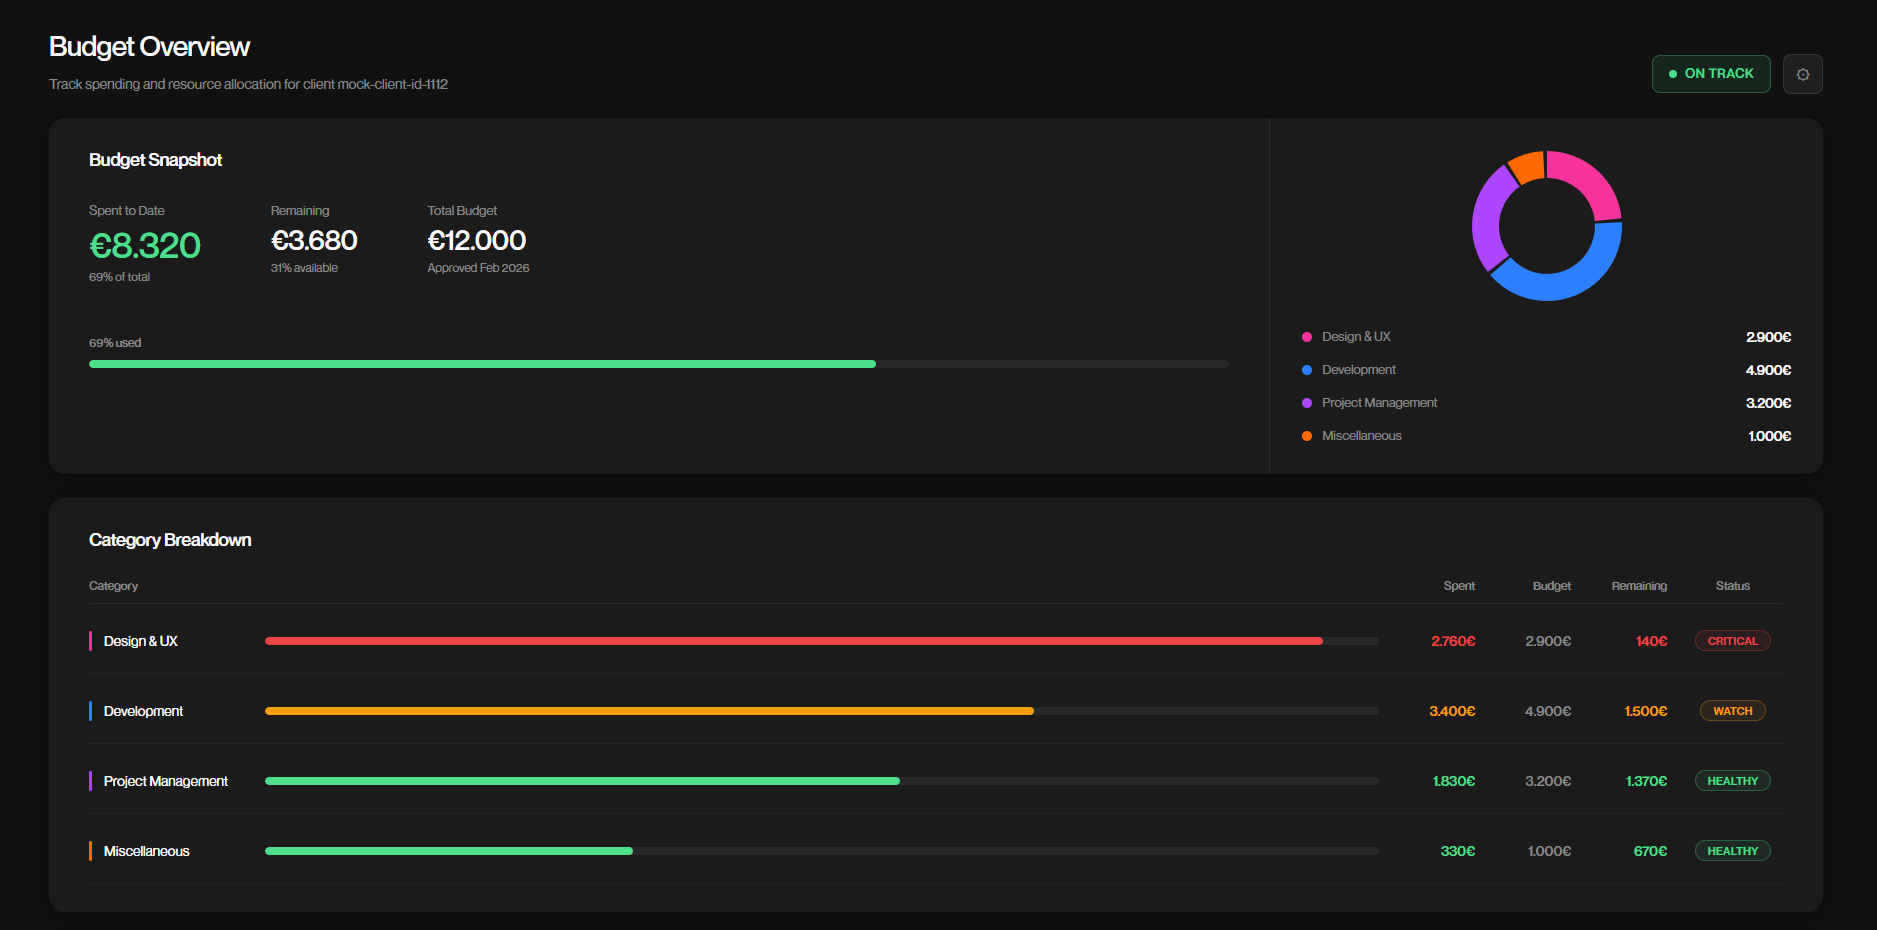
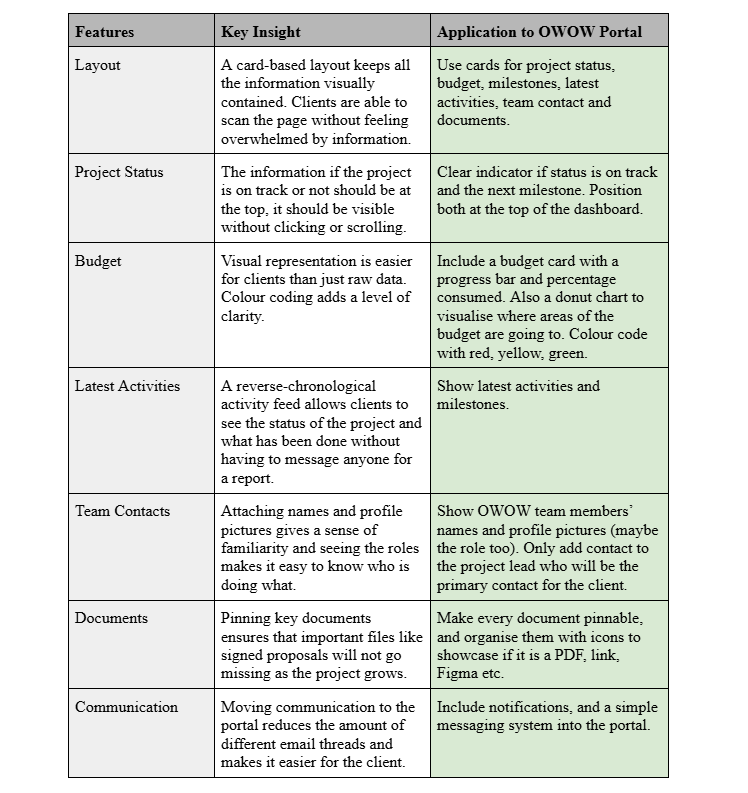
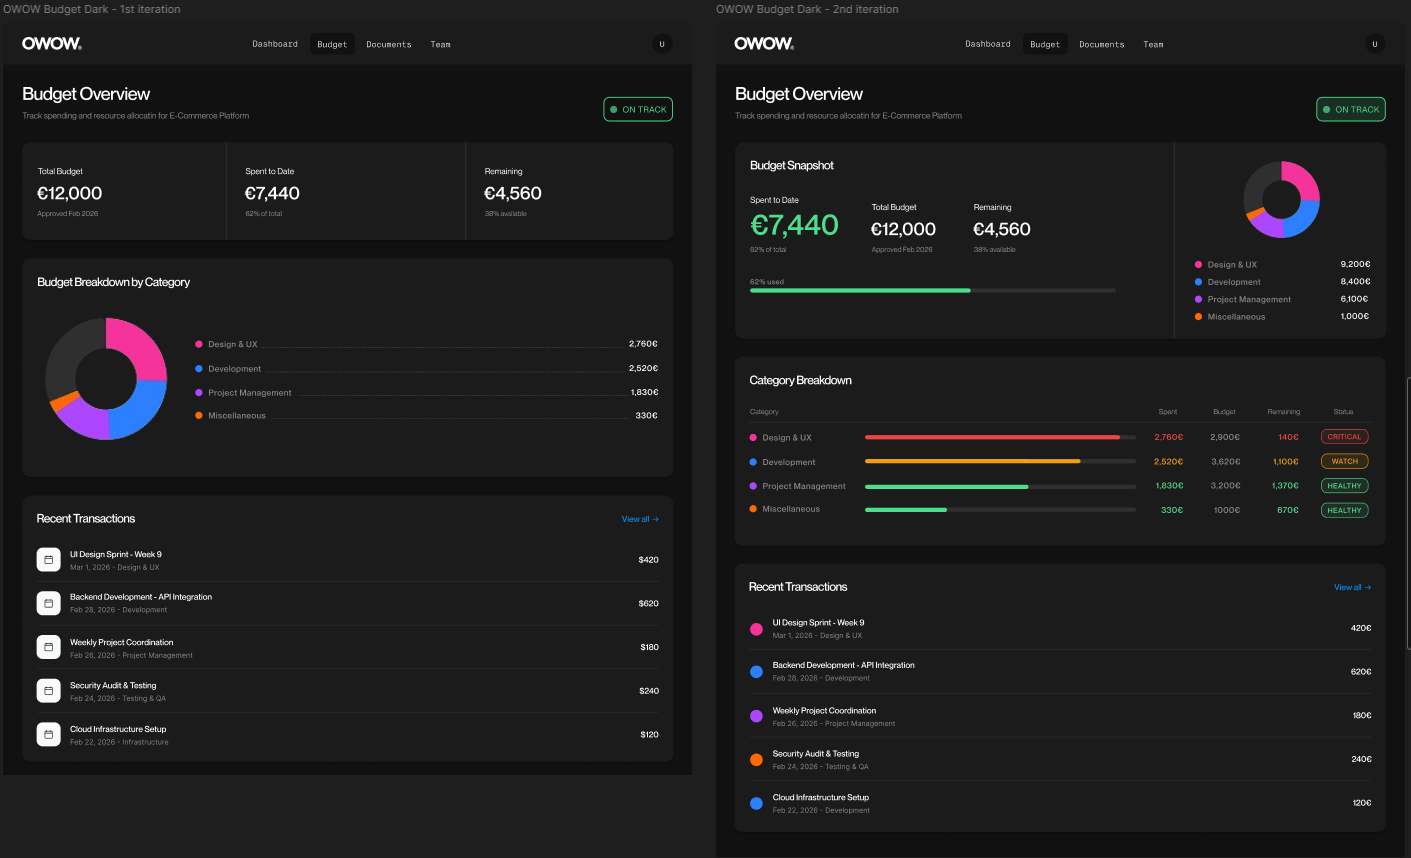
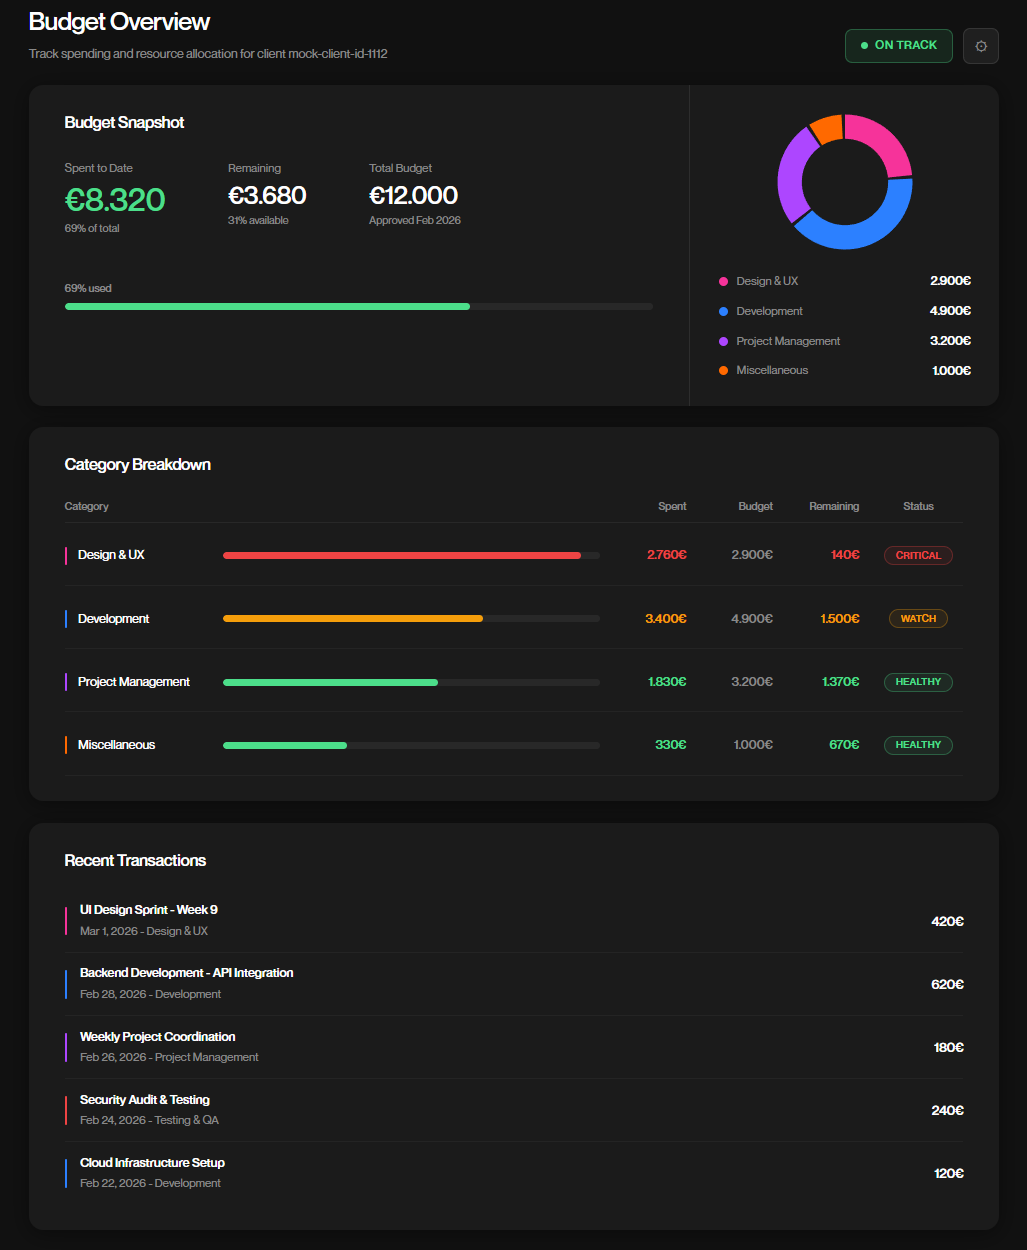
For the budget page I went through several iterations, trying out different ways to show the category breakdown. I tested coloured dots, then switched to a left side coloured line border on each row which made the table feel a lot cleaner. I also added colour coded status badges showing CRITICAL, WATCH, and HEALTHY so a client can see budget health at a glance without having to read through numbers. The client was happy with the whole page and liked that the design decisions came from actual research.
I was responsible for building the full budget feature across both the admin and client sides of the portal. All budget data is stored in Supabase and fetched live, which was new territory for me and something I had to figure out as I went.
The biggest thing I learned on this project was how to work with Supabase and connect my frontend code to a real database so that everything works seamlessly together. Coming from projects where I simulated data with Pinia, actually fetching live data from a backend was a big step forward for me and something I want to keep working on.